THINK YOUR FACEBOOK ADS ARE FAILING? COMPARE AGAINST THESE BENCHMARKS.
If your business is on Facebook, chances are, you’re running a few Facebook ads. You may be running ads to boost your Facebook Likes, increase post engagement, drive site traffic, or even increase conversions. But how do you know if your ads are working?
Of course, it’s important to track advertising objectives and costs per action. And you’ll want to gauge ad and campaign performance against your business's historical data. But sometimes… Well, sometimes you just want to know how you’re doing compared to other businesses, right?
That’s where Facebook Ad benchmark reports come in handy. Here are findings from the Global Facebook Advertising Benchmark Report by Nanigans.
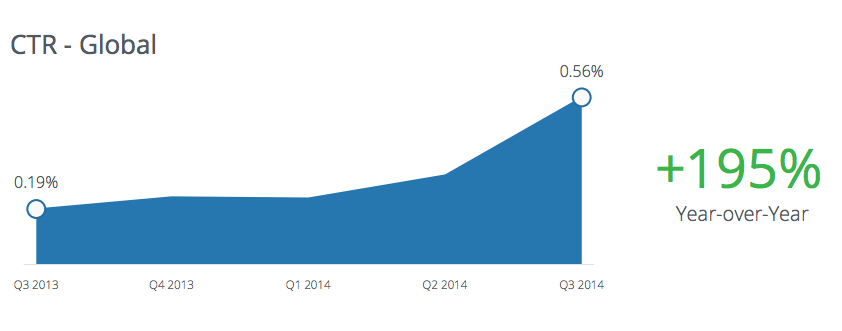
Click-Through Rate (CTR)
The report found that CTRs for Facebook ads continued to climb through 2014. This is great news for Facebook advertisers – it means users are engaging with Facebook ad messages at an increasing rate.
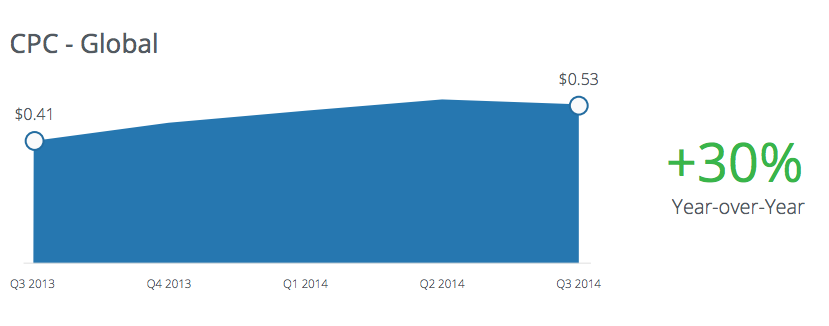
Cost Per Click (CPC)
Over the Q3 2014, the average CPC for Facebook advertising dipped slightly compared to the previous quarter. Overall CPC increased 30% from Q3 2013.
Cost Per 1,000 Impressions (CPM)
Average CPM on Facebook desktop and mobile combined increased 80% from Q2 2014 to $2.98.
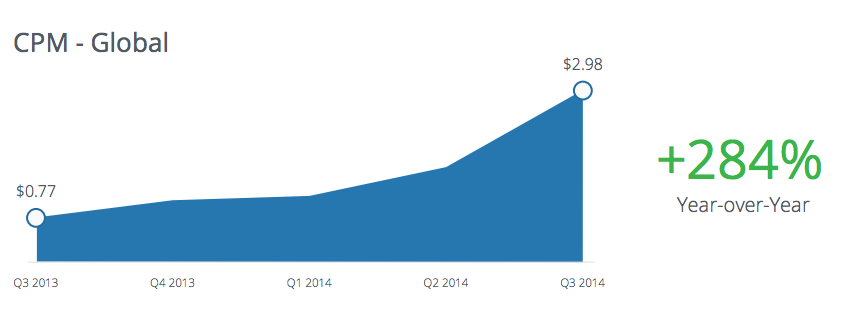
Despite this steeply climbing CPM, Facebook advertisers are still able to drive clicks and engagement at relatively lower costs. How? Note above that CTRs are increasing in strength – meaning more people, relative to the number of impressions, are clicking on ads. And, despite the sharp CPM rise in costs, the CPC cost has only modestly risen, and from Q2 2014 to Q3 2014, the cost actually dipped!
So what does this mean in plain English?
It means you should be strategic when you develop your Facebook ad strategy. Your target goals shouldn’t focus on impressions, or how many times your ad has been served. The CPM route is expensive.
Instead, leverage your ads to drive toward hard-and-fast outcomes that impact your bottom-line marketing goals and outcomes. Optimize your Facebook ads and campaigns for clicks (those CPC and CTR metrics are positive proof points), engagement, conversions, or other well-defined objectives.
Why has Facebook CPM increased so much?
This one can be answered pretty easily with three words: Supply and Demand. One of the most influential reasons CPM has increased so sharply is the overall higher demand for the News Feed. More Facebook advertisers want access to the News Feed. There’s limited “space” in the News Feed for ads. So we all end up paying more to get seen.
Note: Because CPM is rising so sharply, this is another great reason for testing your ads across a variety of target audiences to find the most optimal fit – audience members who are interested in your product, service or industry and who will take action.
Ad Spend
To date, Facebook offers ten different advertising objectives, or ad types. The Nanigans report indicates that three ad types – Unpublished Page Post Link Ads, Mobile App Install Ads, and Domain Ads – made up 95% of the total ad spend in Q3 2014.
Additionally, Facebook advertisers continue to place an emphasis on mobile. At Q3, 62% of Facebook ad spend was allocated to reaching users on their mobile devices.

A Cautionary Note on Using these Benchmarks
It should be noted that CTRs, CPCs and CPMs can vary greatly across Facebook ad types. To provide an indication of how much variability there is across ad types, consider this chart from a 2013 report by Salesforce called The Facebook Ads Benchmark Report.
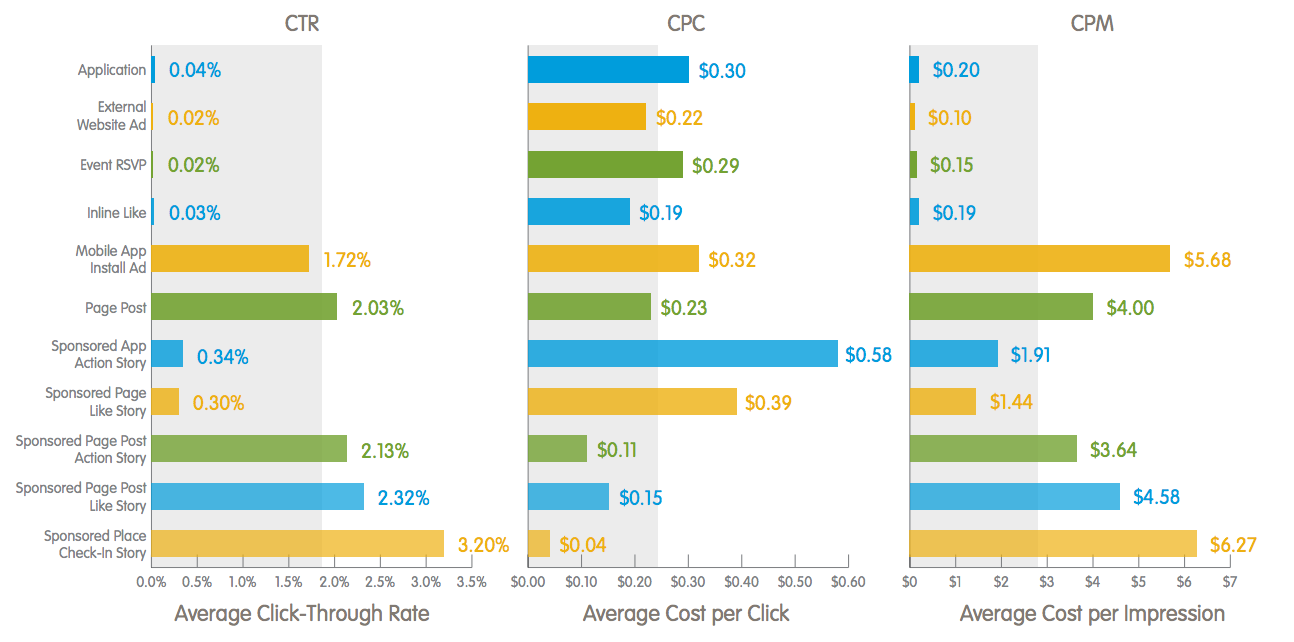
The data from this report is now outdated, and it was published prior to the rollout of Facebook’s most recent ad objectives. As such, you’ll notice that the ad types listed here don’t map well to today’s Facebook objectives. Even so, the charts reveal an important reality – there is massive variability in these metrics across the various ad types.
Because of this large degree of variablity, it would have been helpful to see the Nanigans report provide an additional breakdown of metrics across each of the ten Facebook ad objectives.
But, since that breakdown is missing, be sure to use extreme caution in comparing any one Facebook ad or campaign to the more recent Nanigans reported benchmarks. Until up-to-date benchmarking data is available across individual Facebook ad objectives, it’s best to use these numbers as general benchmarks for your overall, aggregated Facebook campaigns.
Do you have a favorite Facebook Ads Benchmark report that you like to reference? Share in the comments below!
Share this
Getting Results from Facebook Ads: How we boosted traffic (300%) and social engagement (276%)
What is Facebook Ad Relevance & Why it Matters for Your Business

/Accreditations/CRM-Implementation-Accredited-Badges.png?width=170&height=138&name=CRM-Implementation-Accredited-Badges.png)
/Accreditations/Onboarding-Accredited-Badges.png?width=170&height=137&name=Onboarding-Accredited-Badges.png)
/Accreditations/Custom-Integration-Accredited-Badges.png?width=170&height=137&name=Custom-Integration-Accredited-Badges.png)